


A quick search on the PubMed database reveals nearly 1,000 scientific papers linking blood viscosity to cardiovascular disease events and risk factors.
In fact, inc") reased blood viscosity is the only biological parameter that has been linked with all of the other major cardiovascular risk factors, including high blood pressure, elevated LDL cholesterol, low HDL, type-II diabetes, metabolic syndrome, obesity, smoking, age, and male gender.
reased blood viscosity is the only biological parameter that has been linked with all of the other major cardiovascular risk factors, including high blood pressure, elevated LDL cholesterol, low HDL, type-II diabetes, metabolic syndrome, obesity, smoking, age, and male gender.
This led to the proposition, which is becoming more widely accepted, that blood viscosity is the unifying parameter for CVD. Increased viscosity may be the reason why the other biochemical, metabolic and demographic factors are important, and provides the underlying mechanism through which these other factors convey the pre-inflammatory insult to the arterial walls (Sloop GD. Med Hypotheses 1996; 47:321-5).
Simply put, blood viscosity is the thickness and stickiness of blood. It is a direct measure of the ability of blood to flow through the vessels. It is the critical biophysical parameter that determines how much friction the blood causes against the vessels; how hard the heart has to work to pump blood; and how much oxygen is delivered to organs and tissues. Importantly, high blood viscosity is easily modifiable with safe lifestyle-based interventions.
In past decades, nearly all blood viscosity research was performed using primitive manual viscometers. New testing methods are making it much easier and more practical for us, as clinicians, to screen all of our patients, including those who are asymptomatic. We can use this biomarker for earlier and more accurate detection of cardiovascular and cerebrovascular disease risk.
Is CVD a Biomechanical Disease?
A book titled, The Origin of Atherosclerosis, by the late cardiologist Kenneth Kensey and world-renowned fluid dynamics expert Young Cho, articulated a paradigm shift from a biochemical to a biophysical basis for understanding the cause of heart disease and stroke. Kensey and Cho were sparked by a single question—a question through which they discovered the root cause of CVD. The question is this: Why is atherosclerosis site-specific?
Why do atherosclerotic plaques occur in certain regions of the body and not in others? Why do these lesions occur in large vessels close to the heart, the arteries feeding the heart and brain, but never in the arteries of the arms or in a woman’s mammary arteries?
Wrestling with the site-specificity of atherosclerosis, Dr. Kensey, Professor Cho, and others came to a conclusion that the root cause of CVD is biomechanical—not biochemical or strictly epigenetic. If, for instance, LDL or some other metabolic, biochemical stimulus was the primary culprit behind coronary and carotid lesions, wouldn’t we expect to see atherosclerotic lesions more uniformly throughout the body?
In fact, lesions occur in specific arteries, which are in close proximity to the heart and absorb the kinetic force of blood as it is ejected from the left ventricle. The exception, which also happens to prove the rule, is peripheral artery disease, where occlusions form in the arteries of the legs. In these cases, the pull of gravity causes blood to accelerate when a person is standing upright, elevating blood pressure in the legs and increasing friction.
Lesion-prone sites in the vasculature are those that face the most turbulent hemodynamic forces. Therefore, we have zeroed in on vulnerable blood: Blood that is too thick or sticky, that increases friction and, causes biomechanical abrasion, injury and inflammation at the arterial wall.
Blood viscosity is the key parameter that modulates hemodynamic forces like shear stress and strain in the vessels, as well as blood pressure. Through a process called mechanotransduction, hyperviscosity is the root cause of the pre-inflammatory injury that triggers endothelial dysfunction and sets in motion a cascade of events that result in the hardening and thickening of arterial walls.
A simple analogy—one that patients can easily understand–is that of a gardener whose hands gradually become calloused after repeated friction and abrasion from tools, stones, and other rough materials.
Blood: A Forgotten Organ System
One might be tempted to think of blood simply as an irrigation system for the body’s organs, a carrier for hemoglobin and other important molecules, or as a hydrating and lubricating fluid. But it is important to remember that the blood is an organ in and of itself; a very large collection of living cells that interact with one another. The blood is 3-4 times larger by volume than the brain, and 2-3 times larger than the liver.
Blood is a vigorous organ insofar as it behaves as a non-Newtonian fluid, which means that its viscosity changes as a function of shear rate. Think of shear rate as velocity. When blood moves quickly as in peak-systole, it is physically thinner; when it moves slowly during end-diastole, it is thicker and stickier. This is because red cells aggregate. The phenomenon is known as the shear-thinning, non-Newtonian behavior of whole blood (Cokelet GR, Meiselman HJ. Blood rheology. In: Baskurt OK, et al. Handbook of Hemorheology and Hemodynamics. IOS Press, 2007; 45-71).
Blood viscosity is defined as the inherent resistance of blood to flow, and is a highly dynamic property. This is in contrast to hematocrit, lipid profiles, glucose, creatinine, plasma protein concentrations, among others, which are relatively static at any given moment in time. Normal adult blood viscosity is: 40/100, which is read as “forty over one hundred” and reported in units of millipoise.
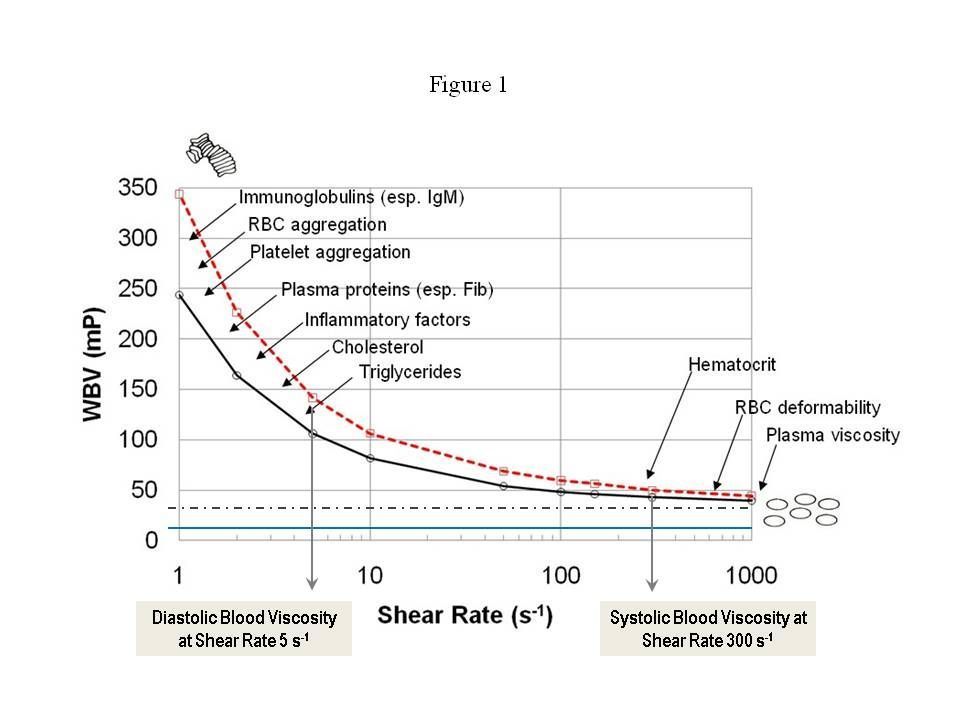
Figure 1 shows viscosity curves for two apparently healthy males, both with hematocrit of 45. The dotted line is a constant viscosity of 35 millipoise [mP], depicting a Newtonian fluid, and the blue line is the viscosity of water at 10 mP. Human blood varies dynamically from the left-side of the figure to the right-side and back again during each cardiac cycle. At systole (high shear rate), blood is thinner, while at diastole (low shear rate), blood is 2-5 times thicker, sometimes even more.
It is critical to test both systolic and diastolic blood viscosity for each patient—just as we do for blood pressure. As clinicians, we prefer to measure viscosity in millipoise [mP], which is convenient for reporting with other vital signs like blood pressure.
Instrumentation Advances
Historically, a lack of clinically practical instrumentation was the major impediment to wider acceptance of blood viscosity assessment as a routine risk measurement. Rotating viscometers, developed by NASA decades ago to study blood viscosity in astronauts, yielded incomplete results because they were able to measure viscosity at only one shear rate at a time. Each shear rate value would have to be manually “dialed in” to the machine, and the instruments had limited ranges for which they could give accurate measurements.
None the less, over the last five decades, clinical researchers have used these primitive machines and published ground-breaking insights. But because viscosity tests were performed at different shear rate values, standardization of methods was impossible, and meta-analyses were technically difficult.
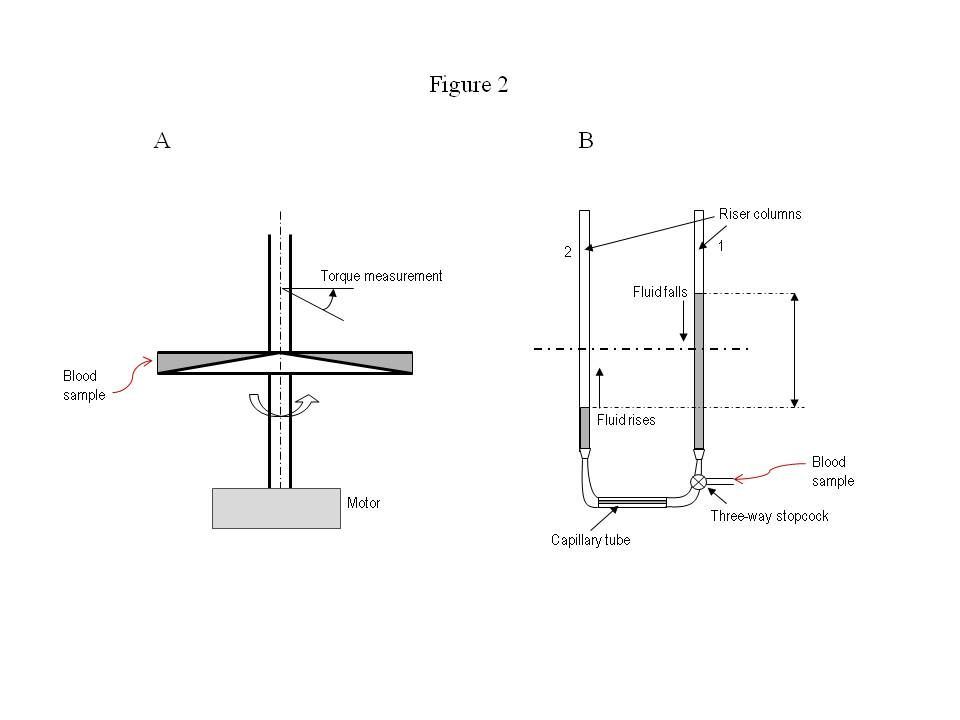
Figure 2A, shows a schematic for a rotating cone-and-plate viscometer. This instrument was developed in the 1960’s; some variant of this design has been used in the vast majority of blood viscosity studies over the past five decades.
The mechanism involves two discs: one is cone-shaped and rotates at a certain angular velocity, and the other is flat and stationary. The blood sample is placed between the two discs, and rotation of the cone drags fluid layers, generating tangential friction (or shear force) on the flat, stationary disc. The flat disc is connected to a highly sensitive spring and turns at a small angle depending on the fluid’s viscosity. The torque and distance of action measured by the spring is used to determine the viscosity of blood (Wells RE, et al. J Lab Clin Med 1961; 57: 646-56).
This process can be time-consuming and technically demanding since it is repeated at different cone RPM’s for each shear rate measurement. Fortunately, there has been a major step forward in instrumentation over the last 10 years.
Figure 2B shows a schematic diagram of a disposable capillary tube used in the state of the art automated scanning viscometer. The blood sample is introduced into the right column through a valve. A computer-controlled three-way valve allows blood in the right column (1) to fall, and blood in the left column (2) to rise, equilibrating by gravity. The instrument detects fluid height changes and determines viscosity by the pressure drop and flow rate.
The flow rate is controlled by the U-shaped geometry of the disposable tube and the diameter of the horizontal capillary tube. Over the course of a viscosity test, the flow rate changes from an initial maximum speed down to zero when the two fluid levels in the riser columns reach the same height.
From a single scan, the machine can acquire data on the complete range of shear rates experienced in a cardiac cycle. It provides consistently accurate viscosity measurements at all shear rates (Wang S, et al. Clin Chim Acta 2003; 332:79-82). Moreover, the disposable tube system obviates the need for an operator to clean up blood specimens between tests. In all its aspects, viscosity testing has become vastly more practical than it was in the past.
Viscosity & Other CVD Risk Factors
The new instrumentation gives us the possibility of standardization, of widespread viscosity screening, and of stratification of the general population for CVD risk based on viscosity profiles. Most importantly, it opens the possibility of earlier, targeted treatment. This will no doubt engender further research, but for the moment, we can draw significant conclusions from work that was done with the more primitive viscometers.
The largest blood viscosity study ever conducted was part of the Edinburgh Artery Study in the 1990’s, which followed a random population of 1,592 middle-aged adults for a mean of 5 years. It showed that blood viscosity, after adjustment for age and sex, was significantly higher in patients experiencing heart attacks and strokes than those who did not (p=0.0003). The 20% of the individuals with the highest viscosity had 55% of the major CV events during the 5-year period. In contrast, only 4% of those in the lowest viscosity group had any significant events.
What is remarkable is that these findings were based solely on measuring systolic blood viscosity (that is, high shear rate viscosity), where the variation range is very narrow. Even so, the link between systolic blood viscosity and CV events was statistically as strong as the links between diastolic blood pressure and LDL cholesterol on one hand, and CV events on the other. The association between systolic viscosity and CV events was stronger than that between smoking and CV events (Lowe GD, et al. Br J Haematol 1997; 96:168-73).
In a prospective study, 331 middle-aged men with high blood pressure were followed for up to 12 years after measuring diastolic blood viscosity (i.e., low shear rate viscosity). The subjects were divided into three groups according to viscosity levels: those in the highest tertile had more than three times more CV events than those in the lowest tertile (hazard ratio = 3.42, 95% confidence interval = 1.4-8.4, p=0.006), (Ciuffetti G, et al. Eur J Clin Invest 2005; 35:93-8).
In a study of 128 obese people (BMI > 28 kg/m2) and 90 non-obese healthy controls, diastolic blood viscosity was 15% higher in obese vs. non-obese patients (Rillaerts E, et al. Int J Obes 1989; 13:739-45). Numerous other studies have also shown that type-II diabetics have higher systolic and diastolic viscosity than healthy non-diabetic people. Patients with metabolic syndrome have higher viscosity than those without, and viscosity scores can predict incident diabetes in initially non-diabetic adults.
Many studies have linked cholesterol with blood viscosity; LDL is consistently associated with higher blood viscosity, while HDL is associated with lower viscosity (Sloop GD, et al. Clin Sci 1997; 92:473-79). It is interesting that smoking causes blood viscosity to surge by as much as 20%, depending on the degree of cigarette use (Ernst E. J Cardiovasc Risk 1995; 2:435-9). This is a fact worth pointing out to patients who continue to smoke.
Clinical Experience with Viscosity Assessment
In our own clinic, we regularly observe patients who are similar in age, having the same gender and race, but with widely different blood viscosity scores. The difference can be greater than 100%. This large dynamic range highlights its potential utility as a biomarker for stratifying patients, providing additional diagnostic power to predict clinical outcomes. Viscosity testing provides a critical tool for identifying patients before acute adverse events occur or symptoms present.
At the Tahoma Clinic, we use blood viscosity not only to screen patients but also to monitor and track the effectiveness of our treatments, especially those directed to improve circulation and perfusion. Most primary care practitioners are already employing therapies that contribute to lower blood viscosity and improved blood flow such as blood donation, therapeutic phlebotomy, nattokinase, and fish oil. It is useful to be able to monitor the changes over time.
While we are able to achieve the same or greater effect with natural treatments at our clinic, it is interesting to note that the two best-selling, small-molecule pharmaceuticals in the world, Lipitor and Plavix, have been shown to lower diastolic blood viscosity by 18% in separate studies (p<0.01 for both drugs) (Banyai S, et al. Atherosclerosis 2001; 159:513-9; Ciuffetti G, et al. Clin Hemorheol Microcirc 2001; 25:31-9).
Viscosity testing is indicated for any patient with a personal or family history of heart disease, stroke, hypertension or diabetes; for women with a history of taking oral contraceptives, especially those that decrease the frequency of menstrual periods; for women who have had a hysterectomy, have irregular periods or are menopausal; women with a history of pregnancy-induced hypertension or preeclampsia, especially those who are currently pregnant; patients with ocular disorders such as macular degeneration or glaucoma; and patients with signs of decreasing cognitive function.
END
Drs. Ralph E. Holsworth, Jr. & Jonathan V. Wright are practitioners and clinical researchers, who serve on staff at the Tahoma Clinic in the Seattle area, a facility founded by Dr. Wright. Dr. Wright is also the Medical Director of Meridian Valley Lab, which recently acquired the Hemathix Blood Analzyer, the world’s most advanced blood viscometer. After a year of work to validate this lab equipment, Meridian Valley Lab is making the Blood Viscosity Profile available to clinicians in the US through its central lab services.